Understanding Chronic Kidney Disease: A Guide to your personal risk of progression.
Chronic Kidney Disease (CKD) is a serious health condition affecting millions worldwide. Early detection and management are crucial to prevent progression to kidney failure. In this blog post, we’ll explore the
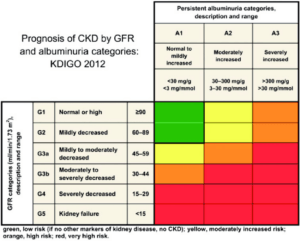 risks associated with CKD, utilizing a heat map to visualize the relationship between Glomerular Filtration Rate (GFR) and microalbuminuria.
What is Chronic Kidney Disease?
CKD is a progressive loss of kidney function over time, typically categorized into five stages based on GFR, a key measure of kidney function. The disease can result from various conditions, including diabetes and hypertension.
Key Terms:
- Glomerular Filtration Rate (GFR): A test that measures how well your kidneys filter blood.
- Microalbuminuria: The presence of a small amount of protein (albumin) in the urine, often an early sign of kidney damage.
The Risks of CKD
Understanding your risk factors for CKD is essential for prevention and management. The primary risk factors include:
- Diabetes: High blood sugar levels can damage the kidneys over time.
- Hypertension: Increased blood pressure can harm the blood vessels in the kidneys.
- Family History: A genetic predisposition can increase your risk.
- Age: The risk of CKD increases with age.
- Ethnicity: Certain ethnic groups are at higher risk for CKD.
Visualizing Risk: The Heat Map
To better illustrate the risk factors associated with CKD, we can use a heat map that plots GFR against microalbuminuria levels. Here’s how to interpret the heat map:
- X-axis: Represents GFR levels, with lower values indicating decreased kidney function.
- Y-axis: Represents microalbuminuria levels, where higher levels indicate more significant kidney damage.
- Color Gradients: Different colors indicate varying levels of risk, with darker red shades representing higher risk areas.
Heat Map Insights
- High GFR & Low Microalbuminuria (Green Zone): Indicates healthy kidney function. Regular monitoring is advised for those with risk factors.
- Moderate GFR & Moderate Microalbuminuria (Yellow Zone-Orange): Suggests early signs of kidney damage. Lifestyle modifications and closer monitoring are necessary.
- Low GFR & High Microalbuminuria (Red Zone): Represents significant kidney damage and a high risk of progression to kidney failure. Pt should seek care from a nephrologist.
Managing Your Risk
If you fall into a higher risk category based on the heat map, consider the following steps:
- Regular Check-ups: Monitor kidney function through regular blood and urine tests.
- Healthy Lifestyle: Adopt a balanced diet, exercise regularly, and maintain a healthy weight.
- Control Chronic Conditions: Manage diabetes and hypertension effectively with the help of healthcare professionals.
- Stay Informed: Educate yourself about CKD and stay updated on new research and treatment options.
Conclusion
Chronic Kidney Disease is a manageable condition, especially with early detection. Utilizing tools like heat maps can help individuals understand their risk levels and take proactive steps toward better kidney health. If you have concerns about your kidney function, consult your healthcare provider for personalized advice and monitoring.
For more information and resources, visit our nephrology group’s website, where we’re committed to helping you maintain your kidney health. Stay informed, stay healthy!